
PROJECT 01Sales analysis
Excel / Sales reportingAdidas Poland Sales Dashboard
An interactive Excel dashboard exploring sales trends, provinces, retailers and sales methods.
ExcelPivot tablesPivot charts
Data. Context. Clear decisions.
At Accenture, I support internal reporting and the delivery of clear, structured information to colleagues through Excel reports and PowerPoint presentations.
Explore selected projects in Excel, SQL, Python and business intelligence, with case studies and source material.
Showing 5 of 5 projects / ALL DISCIPLINES
An interactive Excel dashboard exploring sales trends, provinces, retailers and sales methods.
Deaths and vaccination data were held in separate tables.

A hotel report showing revenue, average daily rate, nights, discounts and parking, with hotel, country and date filters.
A Tableau dashboard showing reported cases and deaths, population-infected measures, country trends and continent totals.

A study using the Reddit API and Pandas to collect SQL-community posts and comments, then explore posting years, topics, sentiment and emotions.
Junior Data Analyst
At Accenture, I update Excel reports and PowerPoint presentations for internal reporting.
Worked in parcel logistics at DHL.
Ran an ecommerce business through OLX.ua.
Master’s degree in Business Administration and Management.
Open a discipline to see how I have used it, then follow the link to the relevant work.
Relational tables, joins, grouping and window functions, with original SQL available to inspect.
Portfolio reports combining filters, summary measures and charts for hotel and project-management data.
A public COVID-19 dashboard with country search, a map, time-series comparisons and continent totals.
Sales dashboards, pivot tables, formulas and VBA, alongside Excel reporting in my work.
A portfolio project collecting SQL-community posts and comments with PRAW and exploring them with Pandas.
At Accenture, I update Excel reports and PowerPoint presentations for internal reporting.
An Excel sales dashboard with pivot charts and slicers.
How do sales vary across the dashboard’s products, retailers and sales methods?
Organised the workbook into pivot-based charts and interactive slicers; its source includes US geography despite the Poland / PLN dashboard label.
An Excel dashboard and downloadable workbook.
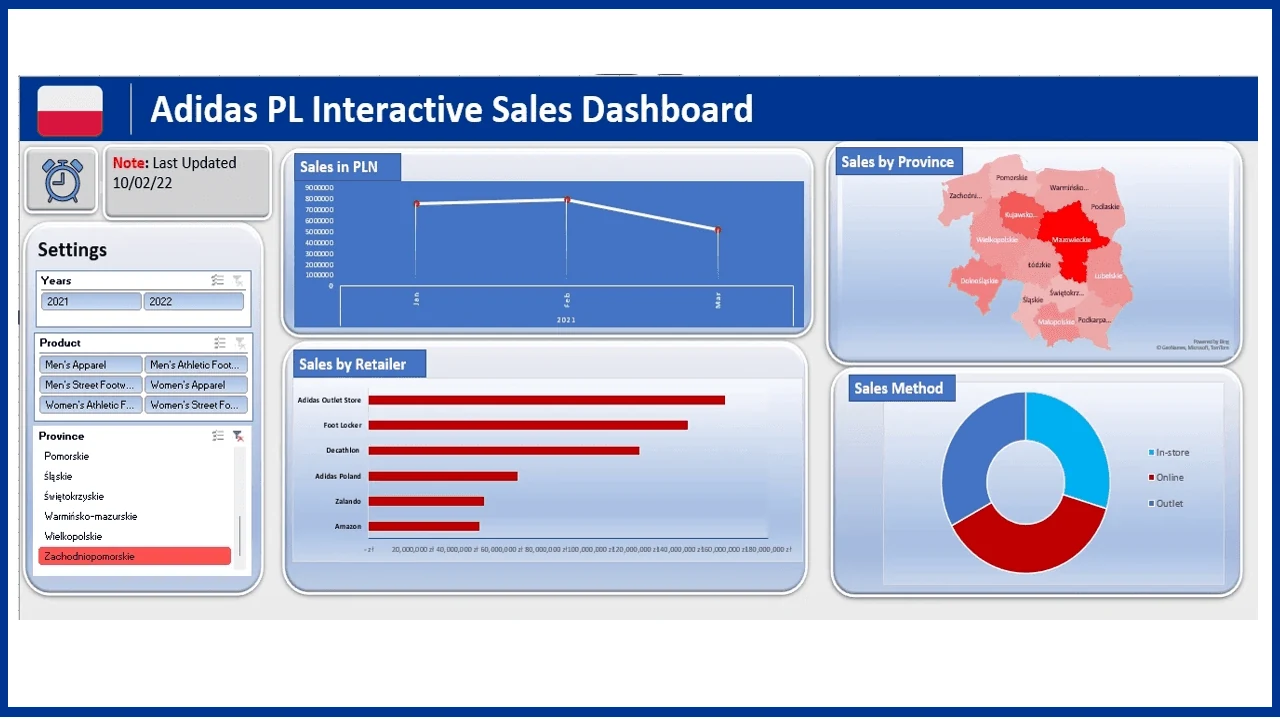
An interactive Excel dashboard exploring sales trends, provinces, retailers and sales methods.
The workbook brings several sales views into one dashboard so a reader can compare categories and filter the results.
The original dashboard is labelled Poland / PLN; the workbook also contains US source geography. Treat its figures as project data, rather than verified commercial performance.
Email me about the role, team or project.